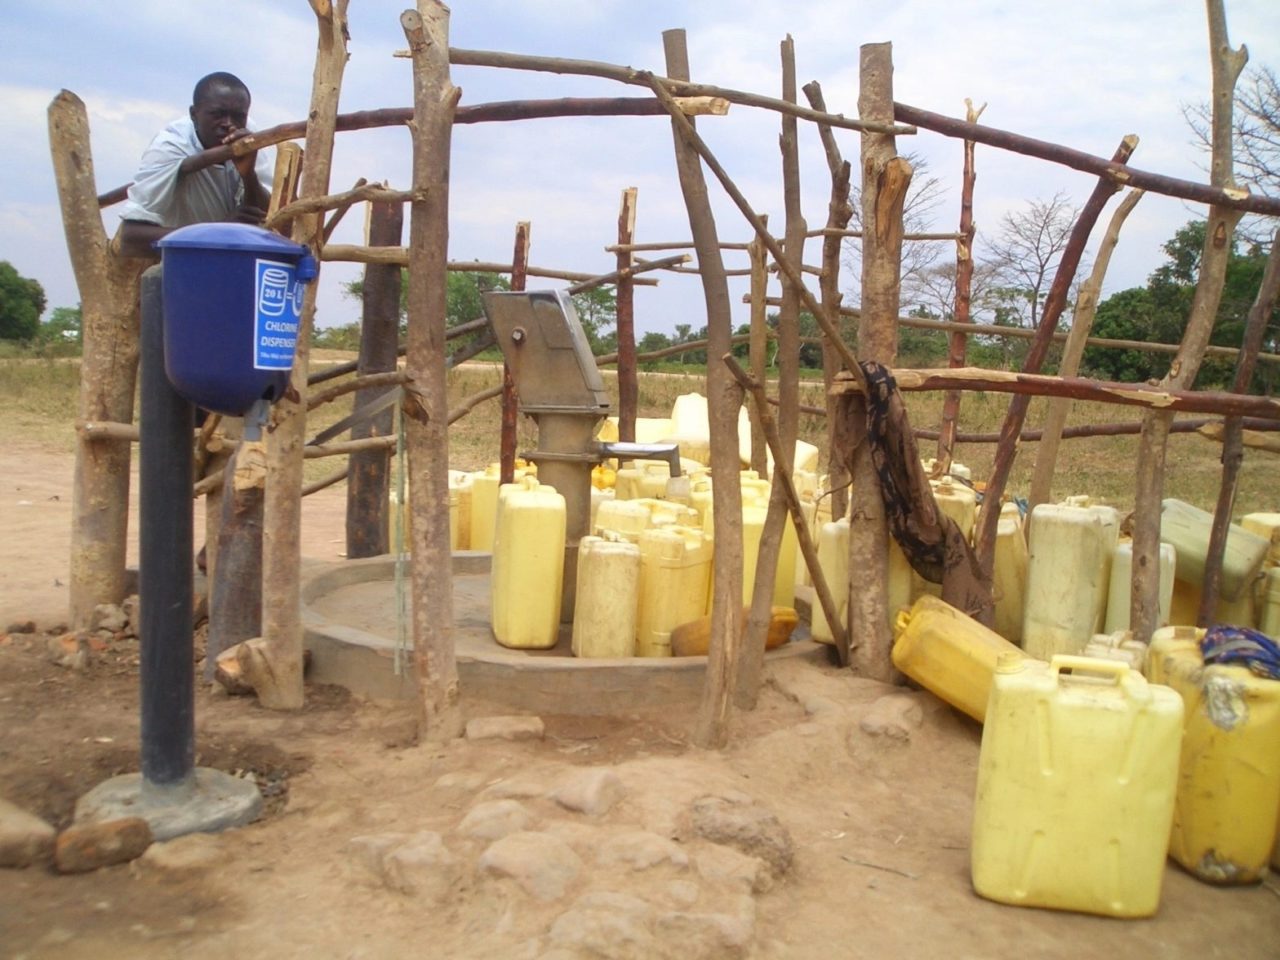
Our adoption numbers for Dispensers for Safe Water in Uganda in early 2015 looked dismal. Adoption refers to the percentage of people in a community that verifiably use Dispensers for Safe Water to chlorinate their drinking water. This is measured by randomly testing drinking water samples in a representative sample of households in a given community. We talk more about what we measure for decision making here. The actual residual chlorine in the water of the sample of households that we test is one of our key performance measures. This adoption rate also impacts our carbon sales, our sustainable financing mechanism for Dispensers.
Our Normally High Adoption Rates Were Dropping. Why?
Our adoption figures hover usually around 47% to 48% with slight variations depending on the country. This is a much higher and much more sustained adoption rate than any other method of water purification at the point of collection or use.
But at the beginning of the year, our adoption rates in Uganda were low – as low as around 30% in some areas. This was in part due to staffing changes in the country that resulted in a less-than-efficient supply chain, community promoters who were not serviced properly, and Dispensers standing empty.
The longer a tank sits empty, the less likely it is that people will use the dispensers. Our research shows that on average, households are 20% less likely to have chlorine in their drinking water where promoters report that the chlorine dispenser has ever been empty. In real time, this translates to a 1.4% decrease in adoption for every day a dispenser is empty in Kenya and a 5.5% decrease in Uganda.
Promoters are also critical lynchpins for the community actually using dispensers. Whether or not the promoter uses the chlorine dispenser in his or her own household is one of the single biggest predictors of adoption in a community, resulting in as much as a 17% increase in adoption over communities where a promoter does not use chlorine. So we were quite concerned when we saw adoption numbers dropping in Uganda.
What Worked in Turning This Around?
With a new country lead in place there, the team started an intensive campaign to fix the supply chain, ensure that Dispensers were filled with chlorine and in good working order, and worked closely with community promoters to reinforce the need for chlorinating drinking water in each village. We took a similar approach in Malawi where there were a couple of districts where adoption rates were declining, albeit from a much higher starting point.
The Malawi team called this ‘super engagement’ – a great term that well described the strategy: Two field offers would ride every day for weeks to the communities that needed attention to meet with the community service officers. It’s these CSO’s job to maintain Dispensers and deliver the chlorine. The field officers would go over weekly goals with the CSOs, talk about any problems or issues with the dissemination of chlorine to the villages, and talk to the local promoters as well to ensure that they had what they needed from the CSOs.
The results of this intensive campaign in both countries were astonishing. Our June 2015 figures show the results: Our overall adoption for Dispensers for Safe Water in June was 51.45%. This is the first time ever that we have crossed the 50% mark overall as a program. Specifically,
- Kenya adoption is up from 47% in May to 48% in June.
- Uganda is now at 46% – an astonishing reversal.
- Malawi continues its impressive record by hitting 91%, up from 77% in May.
In one district in Malawi, in Zomba, where the team ran a super engagement campaign, the results were especially astounding: We have 100% adoption there. This is unheard of in the world of water and sanitation for point of collection products.
We congratulate the hard work of the teams in each country who so successfully identified the specifics of the problem of declining adoption, and aggressively turned it around to a very impressive level.


