Our unique approach here at Evidence Action – while key to how we’ve unlocked such tremendous progress over the past decade – creates complex challenges for the monitoring and evaluation (M&E) of our programs.
This is especially true for Safe Water Now – accurately measuring outcomes for this program requires ongoing iteration and learning. While we’re still adapting as Safe Water Now grows and evolves, we want to share some of the lessons we’ve learned along the way.
Here are 5 ways we navigate the M&E challenges inherent to our Safe Water Now program
1. Our massive scale across several geographies requires us to customize our M&E approach for local context.
Since we’re implementing this program across different geographies – we deliver safe water access to 10 million people across Kenya, Malawi, Uganda, and are now launching in India – we have to adapt our program monitoring approach to align with the realities of different communities, countries, and regions.
For example, in Malawi, we leverage existing distribution systems for chlorine delivery – this is different from Kenya and Uganda, where we have our own delivery network. This means that how we monitor chlorine delivery and supply must be different as well. In Kenya and Uganda, our local teams deliver chlorine refills to the tens of thousands of volunteer promoters that maintain our dispensers. But in Malawi we’re able to store chlorine at local health centers, so promoters collect their refills themselves. We've had to adapt the manner in which we collect chlorine delivery/refill and dispenser spotchecks data to account for this difference. Even now, our team is running a pilot for enhanced digital tracking tools for this chlorine distribution to record higher quality data and avoid inconsistencies.
But it's difficult to aggregate data across geographies that could have used, either slightly or substantially, different methods based on local contexts. There can be differences in precision based on the level of variation within and across geographies. And nuances can get lost when you’re reporting the aggregate, especially if you want to report one figure without a long list of caveats.
We tackle this challenge by using an overarching M&E framework that facilitates reasonable consistency in monitoring activities, KPIs, and the way we report results. This doesn't make reporting aggregate figures less challenging, but helps us understand how aspects of monitoring may deviate and why.
2. We have to balance rigorous data collection against our organization’s unique pursuit of cost-effectiveness – and sometimes that means accepting trade-offs.
Quality monitoring data is very important to our program decision-making, but data collection methods must deliver valuable insights without compromising the overall program implementation budget. We don’t want to outsize our investment in M&E if it means it would detract from important program expenses – like if we had to buy less chlorine, or have a smaller implementation staff. On average, across geographies, we invest about 20% of the Safe Water Now budget in M&E.
We’ve designed Safe Water Now to be incredibly cost-effective – currently we estimate that we provide safe water access for less than $1.50 per person per year on average – so monitoring and evaluation must follow suit. That means that the number of sites we monitor, the number of households we visit, the frequency of monitoring, and the tools we use for testing chlorination are all determined with this in mind.
So, how do we balance collecting comprehensive data as rigorously as possible against maintaining our commitment to cost-effectiveness?
- Prioritization – we identify the most important data points to monitor to understand program performance.
- Level – we determine the administrative level (e.g., district, county) where data collection provides actionable insights.
- Frequency – we establish a schedule based on the need for current data or long-term analysis.
Then, our team uses these inputs to define a strategy that measures the right indicators at the right time.
We prioritize collecting accurate and reliable data that is valuable when analyzing at the aggregate level of our program deployment. We don’t attempt to collect data at lower, more granular administrative levels or for very short timeframes. For instance, our chlorine adoption data is collected quarterly at the district or county level (depending on country). This enables us to effectively understand regional trends within each country for program progress and performance, and allows the program to enhance deployment of resources based on these trends.
Similarly, we calculate other statistics – such as our estimate of the number of people we provide with access to safe water – on an annual basis. This approach allows us to aggregate a year's worth of data collection to create high-quality estimates with a larger and more representative pool of data.
Here’s the trade-off: While this prioritization allows us to see trends and patterns that inform larger-scale policy and program decisions – at the district, office, and country level – it’s less applicable for local use – meaning our results cannot confidently indicate community-level patterns and trends during weekly or monthly time periods. Collecting data with greater local granularity or frequency (e.g., monthly visits to every household) would not be cost-effective.
3. We’re always looking for opportunities to increase our efficiency and agility so that we can make real-time improvements.
One of our organizational values is “iterate, again” – we reflect and adapt constantly. Iteration is a feature of our work, not a bug. This principle applies to how we collect data as well – our M&E processes evolve alongside our programs.
And we iterate quickly – when it comes to safe water, lives are on the line every day – so it’s crucial that monitoring data is collected efficiently enough for real time decision-making.
Here’s one example of how we’ve increased efficiency: We’ve developed a digital application that streamlines how we identify, track, and resolve dispenser functionality issues.
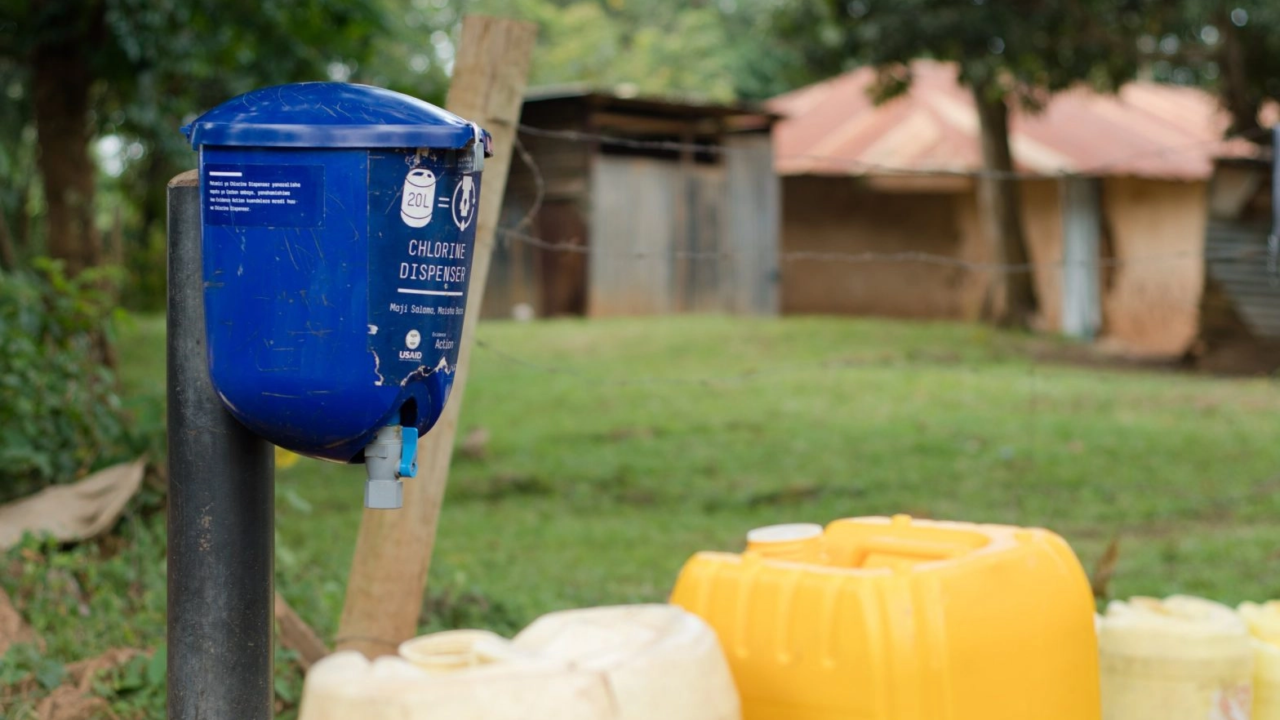
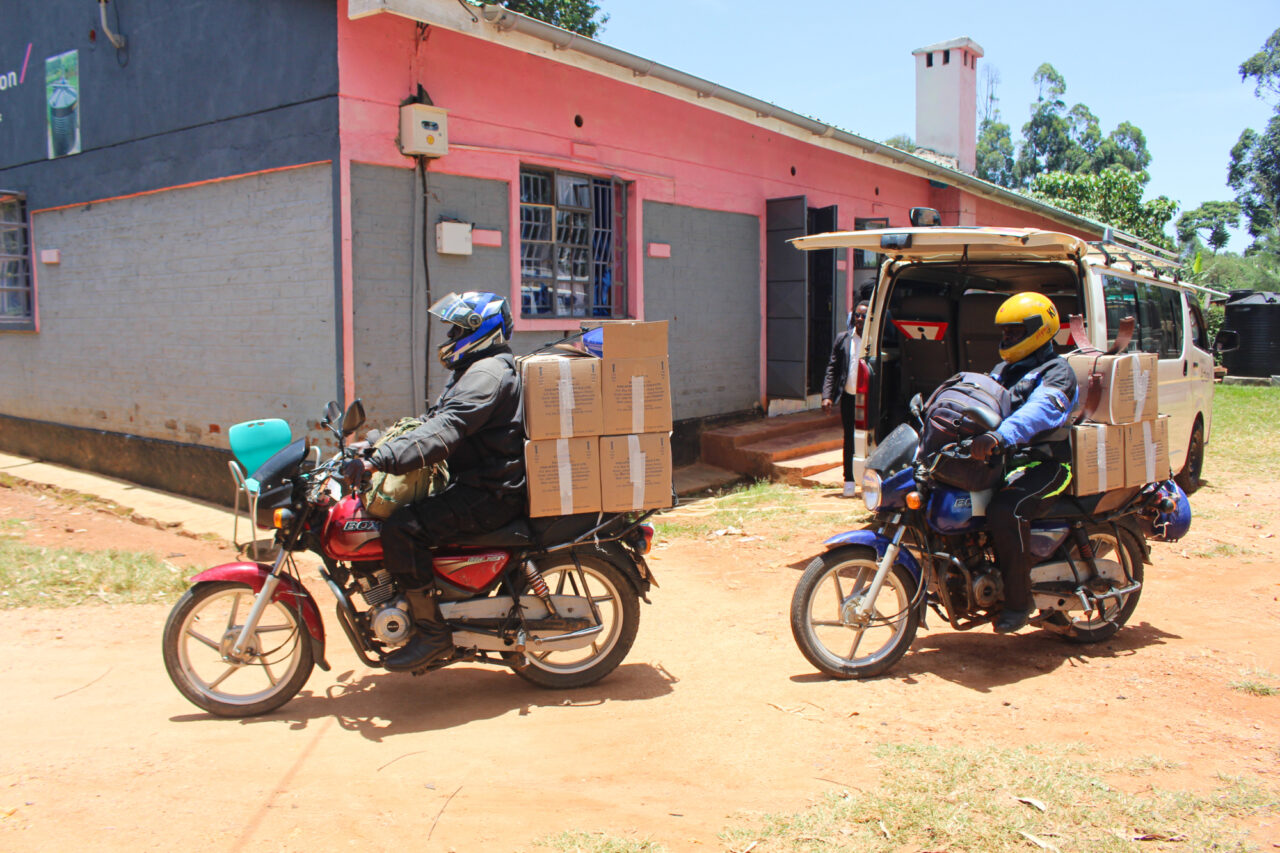
Safe Water Now relies on two important teams that make sure our dispensers are always up and running – our call center staff, based in local offices throughout program countries, and our circuit riders, who travel via motorbike to deliver chlorine and make any necessary repairs. The digital app that we launched allows these two teams to interact more efficiently than ever before – instantly reporting refills or repairs that are needed, and quickly assigning circuit riders to handle it.

4. We need to collect monitoring data that is specific enough to be useful for program decision-making.
We’re always striving to collect data that is specific and useful – so that we can feed the information directly back into the program for decision-making on the most urgent factors of program success.
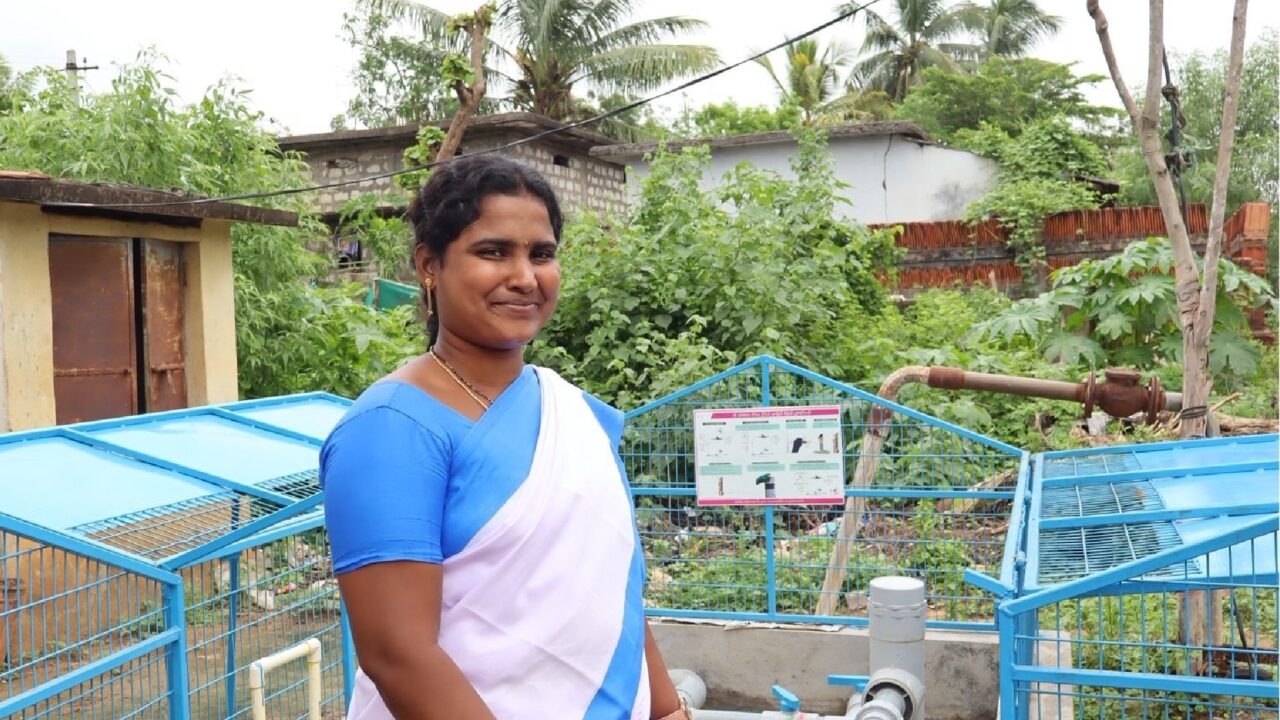
That can be tough in the places where we implement Safe Water Now. We work in many rural, last-mile communities – our vast network of chlorine dispensers stretches across areas of Africa that aren’t reached by municipal water systems. Underserved areas like this do not have strong water-related data systems established. So, we’re often starting off with limited information and have to set up systems ourselves in order to be able to collect data.
Our data collection efforts are designed according to program needs. In particular, we map the network of water points through a verification process and track chlorine adoption by conducting routine monitoring. This data informs how we implement our work, especially in remote areas with limited access to safe water infrastructure. The upshot is that these processes also result in the creation of large datasets that did not previously exist, and may be externally valuable. In fact, we’ve uploaded a batch of our water point mapping data to an open-source platform called The Water Point Data Exchange so that it can be used by other organizations and researchers.
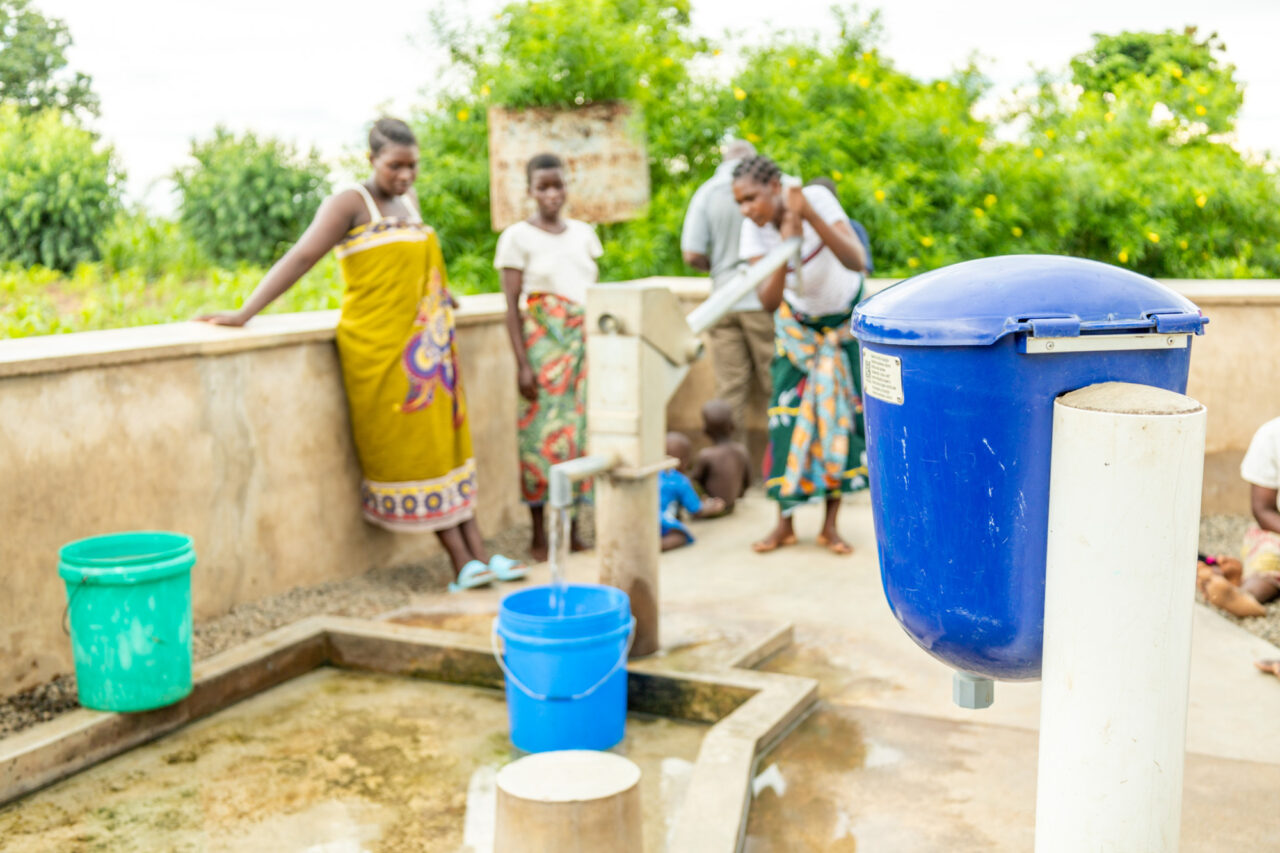
Our approach to measuring user adoption is different from many organizations in the water space – rather than relying on self-reporting, we actually visit households and conduct tests to measure the level of chlorine in their stored water. This measurement allows us to see how many people are adopting our chlorination interventions. Since it would be extremely time-consuming to visit every household near our chlorine dispensers (there are 52,000+ dispensers!), we’ve carefully designed a sampling strategy to efficiently collect reliable data that we can use to estimate our average adoption rates.
We randomly select households that use a water point with a dispenser, and test their stored water for the presence of chlorine on a quarterly basis. Our samples are annually representative for each district or county in which we operate, and are collected in quarterly waves throughout the year, ensuring a sufficient level of confidence in our results to assess progress quarterly and to evaluate outcomes annually. Through this strategy, we’re able to review results in real time and provide regular updates on progress and challenges within the quarterly monitoring periods.
5. We want to effectively communicate our program’s complex metrics to our stakeholders – and being transparent is key to that.
It’s important that we ensure donors, partners, and other stakeholders understand our unique approach to delivering safe water and how that impacts the metrics we report.
One of the ways we do this is by being transparent about our challenges and the adjustments we make over time to our M&E indicators.
Our M&E indicators for Safe Water Now have always been dynamic – rising and falling based on various factors and nuances affecting the program. This is true for both how we measure program performance (chlorine adoption) and how we assess the reach of the program (the number of people with access to safe water). Both increases and decreases can be driven by external factors. Increases may indicate success, but decreases don’t necessarily mean failure. A significant change would trigger a deeper investigation to discover the cause, like whether it was caused by a one-time event or if there is a systemic issue.
Here are two hypothetical examples of external factors that could significantly shift our program’s reach. During the COVID-19 pandemic, many families left cities for more rural areas, increasing the number of people accessing our program – but they might not stay there permanently. And overall development in our program communities may eventually decrease the need for households to use communal water points, dropping the number of those utilizing our chlorine dispensers.
Whether our numbers go up, stay steady, or decrease slightly, this data is valuable for internal decision-making – and for our stakeholders. This transparency allows us to collectively demonstrate the program's impact and continuously improve its effectiveness.
The challenges that arise within our M&E strategy for Safe Water Now create exciting opportunities for us to experiment, iterate (again, and again), and share what we’ve learned. We’re currently working on the annual M&E and cost-effectiveness update for Safe Water Now. Stay tuned for more data insights coming soon.